October 8, 2026
Swing Trading vs Day Trading: Which Style Fits Your Edge?
Day trading and swing trading demand different capital, time and psychology. Here's how to pick the style that matches your actual edge.
Read article
Connect your broker read-only. Every fill arrives already tagged with the setup you traded, the indicators and news that were live at that moment, and the greeks on the contract — then Trade Planner names the habits costing you money and coaches you off them.
Retail day & swing traders · stocks and options · prop and funded accounts
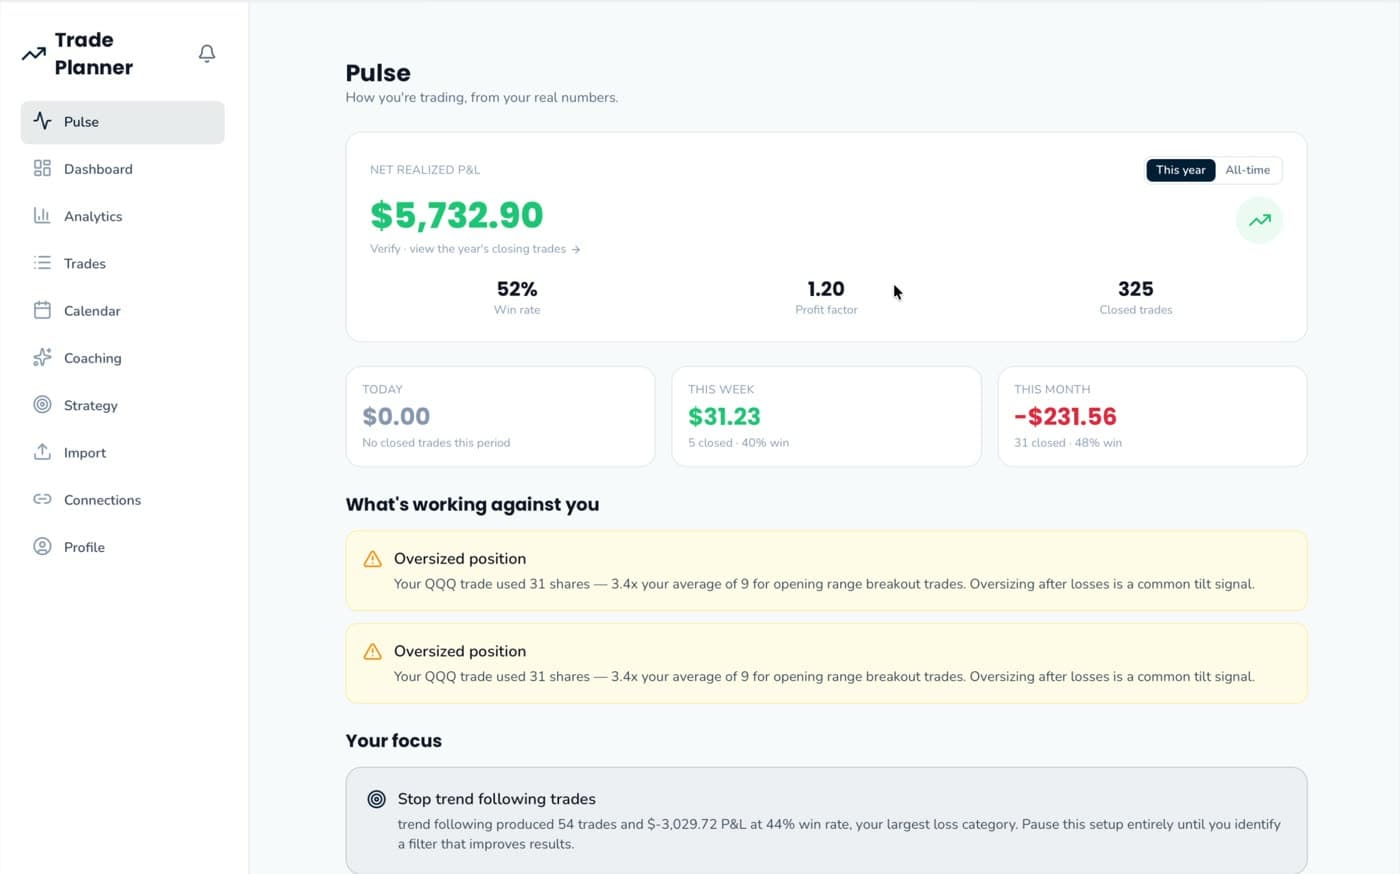
$5,732.90
52%
Win rate
1.20
Profit factor
325
Closed trades
And the why behind it
Your losers are bigger than your winners
Average loss $412.08 against an average win of $233.61 — a payoff ratio of 0.57 across 163 closed trades.
Illustrative account. Every figure in the product is computed from your own fills.
The questions you leave the market with
“Why did I miss that entry? Why did I hold on so long? Why did I sell too soon? What turned my winner into a loser — and I never even saw it coming?”
You don’t start journaling because you’re winning. You start because you’re losing — and you want to get better. Every great trader says keep a journal. None of them mention it’s boring, brutal and manual — so you quit.
Trade Planner takes the manual out and puts the insight in.
Automatic, not manual
No tagging, no note-taking, no spreadsheet. This is the record a single AAPL sell produces the moment it syncs — and every field is queryable, filterable and clickable back to the trade.
AAPL · SELL 31
2026-08-21 09:41:12 · Schwab · imported automatically
-$184.22
Opening Range Breakout
91% confidence · one click to correct
Strong uptrend
one of seven regimes
Opening drive
09:30–10:00 market time
gap +2.1% · broke prior-day high · 94% up its 20d range · >SMA20>SMA50 · RSI 68 · 5d +7.4%
computed from daily bars at your entry, not guessed from the ticker
RSI 68.2 · MACD 1.84/1.21 · SMA20 $472.10 · EMA20 $474.66 · VWAP $478.03
the chart you were looking at, recorded
“Chip demand guidance raised” — Reuters, 08:12 ET
sentiment: positive · with the model's stated reasoning
31 shares — 3.4x your average of 9 for this setup
flagged: oversizing
Bad loss
good win · lucky win · good loss · bad loss · breakeven
Read-only SnapTrade sync across 30+ brokers, plus Thinkorswim, Webull, IBKR and Schwab CSVs — format detected for you. History is backfilled, re-syncs are deduplicated, and multi-leg and partial fills reconcile correctly.
Every entry is classified against the product’s canonical setup list — opening range breakout, VWAP bounce, gap fade, 0-DTE, swing pullback, and the ones nobody admits to: revenge trade, FOMO chase. Write in your own and it becomes reusable across your whole history.
Daily bar and VWAP, RSI, MACD, SMA and EMA, plus the news that was live on that ticker that day with its sentiment — and for options, delta, gamma, theta, vega, implied volatility, break-even and open interest.
Anything the model is unsure about lands in a review queue instead of being silently mislabelled. Your correction is the one that counts.
What you get
01 · The mirror
Realized P&L only, reconciled to your broker statement — no paper gains dressed up as performance. Today, this week, this month, year, all-time, a daily calendar heatmap, and the closing trades behind any figure one click away. Open positions sit alongside with real cost basis, unrealized P&L, days to expiry and a theta warning before the decay eats them.
02 · The diagnosis
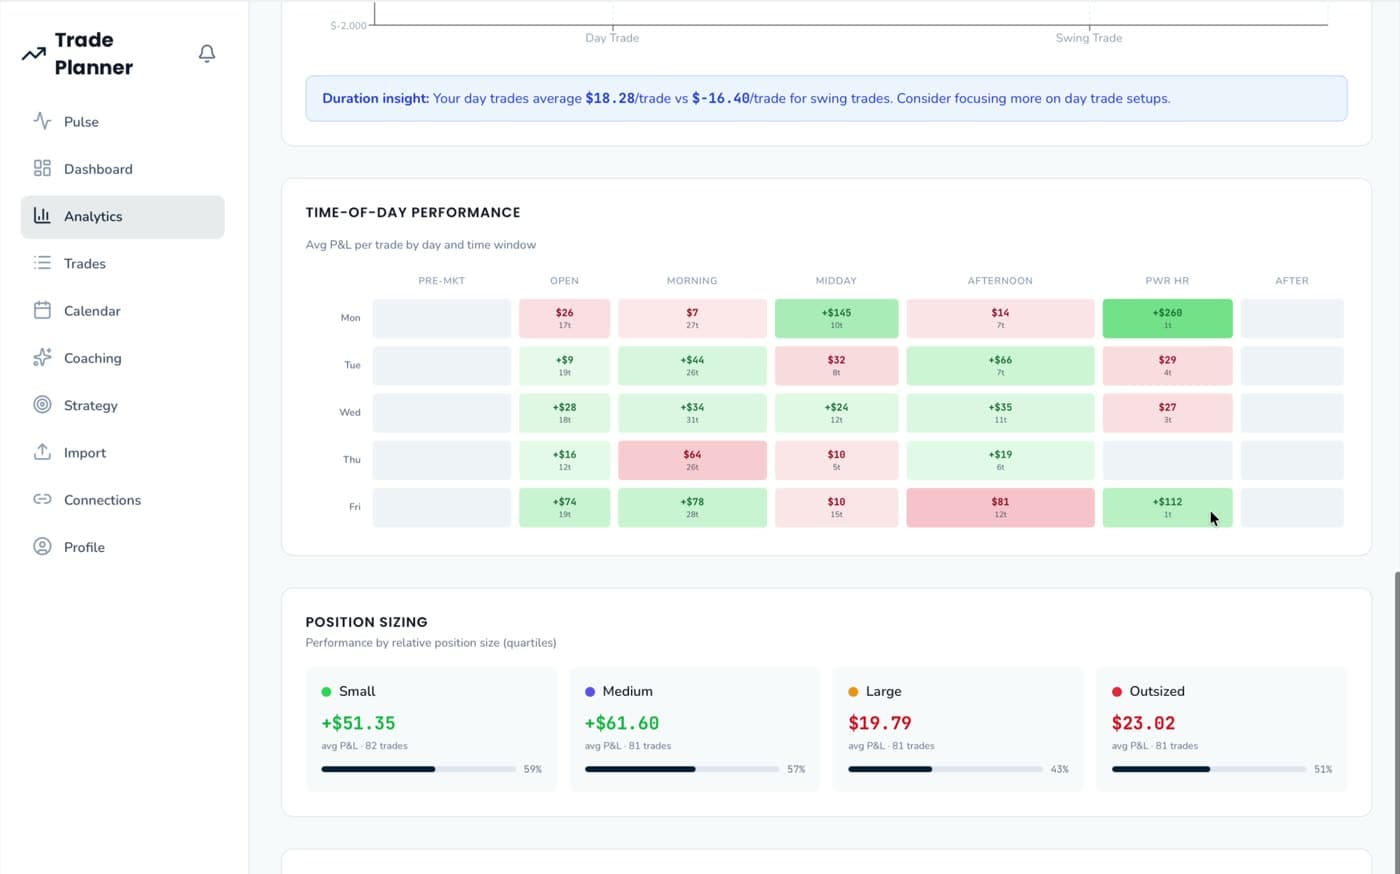
Twelve ways to cut your own record: equity curve, month-over-month, period-vs-period with the win-rate delta in points, P&L by ticker, by setup, by session window, by position-size quartile, by day of week, by holding duration, and the distribution of every outcome. Options roll up by underlying, so a four-leg spread reads as one trade instead of four.
03 · The closed loop
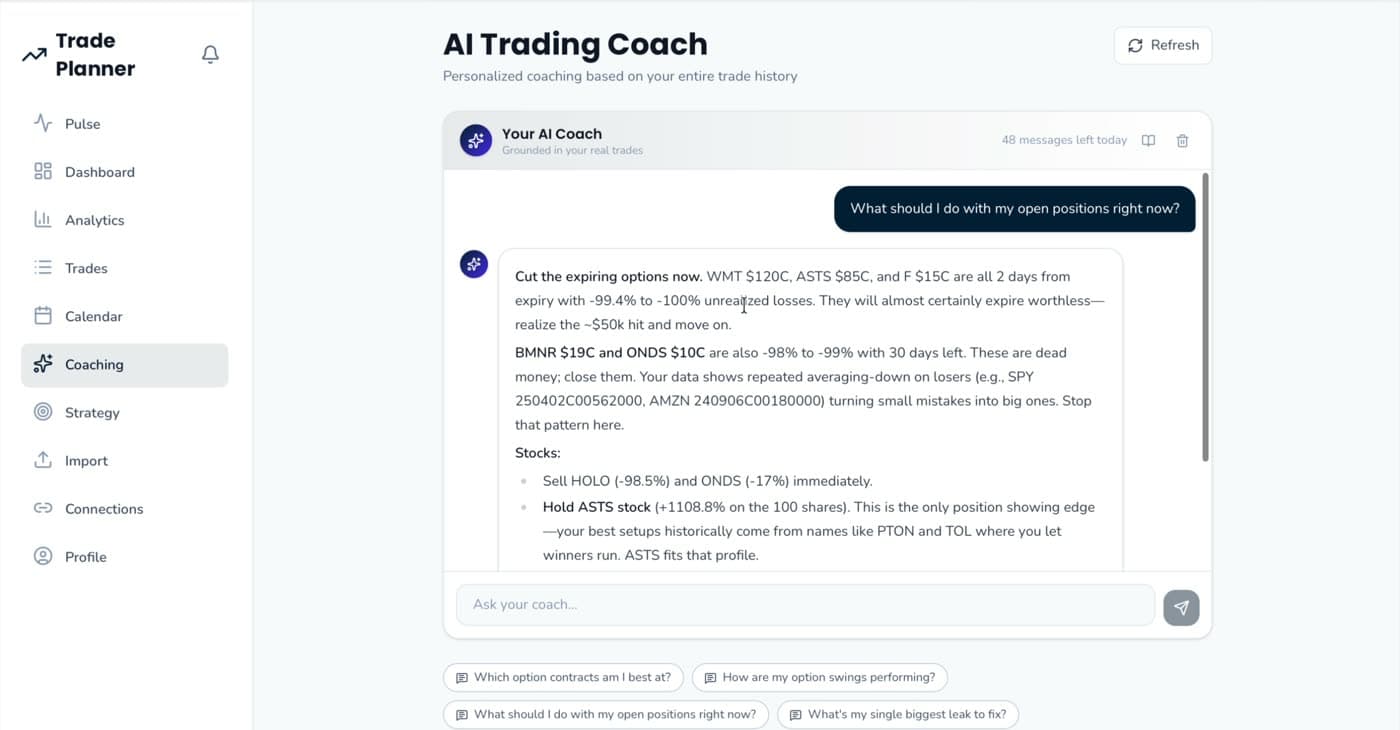
Nine detectors watch for the behaviour, a coach explains it in your own numbers, and a versioned playbook turns the fix into rules you can be held to — then labels each new trade a rule follower, a rule breaker or an edge case. Diagnosis, change, measurement, repeat.
The diagnostic spine
Nine detectors, every one measured against your own baseline rather than a generic rule, every finding carrying the exact numbers that produced it and the trades it came from.
A loss, then the same symbol again inside ten minutes at a bigger size. Named, timed, and priced.
Any entry more than 2x your own average for that setup — 4x and it escalates to critical.
Three or more trades inside fifteen minutes, mostly buys, with the net result of the cluster.
Three or more consecutive losses at increasing size. Martingale, called by name, with the size ladder.
A day at more than 2x your average trade count, with what that day actually cost you.
Average loss bigger than average win. The payoff ratio that quietly bleeds a decent win rate.
Winners held 1.2 days, losers 4.6. The disposition effect, in days and dollars.
The session window where you are net negative under a 40% win rate — sit it out or size it down.
Three or more adds at progressively worse prices on the same contract, same day.
Findings don’t wait for you to go looking. Pulse leads with the worst of them, the notification bell carries tilt alerts as they fire, and the whole list is ranked critical → danger → warning so you fix the expensive one first.
Options are not an afterthought here
A four-leg spread reads as one position across every report, so your expectancy by setup isn’t distorted by leg count. Realized P&L handles expirations, assignments and partial closes.
Delta, gamma, theta and vega, implied volatility, break-even and open interest — captured at the fill and live on anything still open.
Open positions are classed as rapid or accelerating decay, rolled up into a single warning on Pulse: “1 position in rapid decay — theta is eating these.”
Expand any option position for its payoff curve against the current underlying price, with your break-even marked.
Colour-coded on every open position: red inside five days, amber inside fourteen.
0-DTE, weekly scalps, spreads, straddles and strangles are first-class setup types, not free-text notes.
From diagnosis to discipline
Trend following, and it isn’t close. 54 trades, -$3,029.72 at a 44% win rate — your largest loss category by a wide margin.
Your opening range breakouts run +$18.28 a trade over 81 trades. Same account, same month. Pause trend following until you can name the filter that separates the four that worked from the fifty that didn’t.
Your playbook
Built from your own best setups · versioned, with a changelog
Graded against it
Rule follower
QQQ · opening range breakout, median size, exited 10:52
Rule breaker
AMZN $300C · four adds at worse prices, held past 11:00
Edge case
NVDA · gap and go outside the playbook, +$733.20
Educational only. Trade Planner never places an order and never tells you what to buy or sell.
This is real money already at risk. Every figure is computed deterministically by our code — the model receives pre-verified facts and may only explain them. If we can’t verify it, we don’t say it.
P&L, win rate, expectancy, payoff ratio — all from the deterministic pipeline. The model gets the facts and narrates.
Each finding names the fills that produced it and links straight to them. Verify any number on the page in two clicks.
Realized from closing legs only, deduped on re-sync, correct on partial fills and multi-leg options, never matched across accounts.
Disagree with a tag? One click, and your write-in becomes part of your own setup vocabulary from then on.
Account values are masked in session recordings. Nothing is benchmarked or shared against other users.
Who this is for
Intraday timestamps unlock the session-window and revenge-trading detectors. You find out which half-hour of the day is paying you and which one is taking it back.
Hold-time analysis is where the disposition effect shows up: winners cut at 1.2 days, losers nursed for 4.6. Performance by duration puts a number on it.
Greeks, IV, break-even and open interest per contract, decay warnings before expiry, and spreads counted as one position instead of four.
Hard rules in a versioned playbook, every trade graded as follower or breaker, and a PDF trade report over any date range.
Realized matching never crosses accounts — an IRA buy can’t be closed by a taxable sell. Connect them all and the numbers still tie.
Import one month of fills and the worst pattern in it is on screen before you’ve finished reading the page.
Honestly compared
| TradePlanner.ai | Spreadsheets | Basic journals | Replay tools | |
|---|---|---|---|---|
| Getting trades in | Read-only sync from 30+ brokers, plus Thinkorswim/Webull/IBKR/Schwab CSV | Manual entry | Limited | Varies |
| Setup tagging | Automatic against 36 setups, grounded in the daily bars at your entry | You type it | You type it | None |
| Off-chart context | Technicals, news & sentiment, greeks and IV attached to every fill | None | Rarely | Chart only |
| Answering “why” | Nine named detectors, each with the numbers behind it | None | Descriptive stats | Watch it back yourself |
| Options handling | Rolled up by underlying; greeks, decay and payoff | Manual and wrong | Counted per leg | Varies |
| Coaching | Grounded in your trades, cites them, remembers your leaks | None | Generic tips | None |
| Discipline | Versioned playbook; every trade graded follower / breaker | None | Checklists | None |
| Today’s price | Free during beta — every feature | Free (costs you hours) | $29–49/mo | $29+/mo |
Competitor pricing as published by each vendor, August 2026. Trade Planner is not a simulator, a broker or a signals service.
From the blog
Day trading and swing trading demand different capital, time and psychology. Here's how to pick the style that matches your actual edge.
Stop copying trades by hand. Learn how automated broker sync and CSV import eliminate manual data entry so your trading journal stays complete without the busywork.
Trade expectancy reveals the average profit or loss per trade. Learn the formula, see what good expectancy looks like, and find out which setups to keep.
The beta is free — every feature, no credit card. Connect read-only, or drop in a CSV.